v1.0.9
released
released
QuantumOptics.jl is a numerical framework written in the Julia programming language that makes it easy to simulate various kinds of open quantum systems. It is inspired by the Quantum Optics Toolbox for MATLAB and the Python framework QuTiP.
QuantumOptics.jl optimizes processor usage and memory consumption by relying on different ways to store and work with operators. Check out the benchmarks.
The framework comes with a plethora of pre-defined systems and interactions making it very easy to focus on the physics, not on the numerics. Read the documentation.
Every function in the framework has been severely tested with all tests and their code coverage presented on the framework's GitHub page.
To get started with Julia, check out Julia's setup instructions. For plotting we recommend matplotlib in Python, which plays nicely with Julia. Before you can execute any of the framework's functions, you will need to add the QuantumOptics package to Julia, as shown below. Plotting with matplotlib is then enabled by adding the PyPlot package. To install packages, you simply need to start Julia and press the ] key to enter the package manager (see also the Julia docs). Then you can add packages as follows.
|pkg> add QuantumOptics   # Install QuantumOptics.jl package
|pkg> add PyPlot # Support for matplotlib from within Juliausing QuantumOptics
basis = PositionBasis(-2, 2, 200)
x = position(basis)
p = momentum(basis)
H = p^2/4 + 2*DenseOperator(x^2)
energies, states = eigenstates((H+dagger(H))/2, 5)
using PyPlot
xpoints = samplepoints(basis)
plot(xpoints, 2*xpoints.^2)
fill_between(xpoints, 0., 2*xpoints.^2, alpha=0.5)
for i=1:length(states)
plot(xpoints, abs2.(states[i].data).*40 .+ energies[i])
end
xlabel("Position")
ylabel("Energy")
tight_layout()
savefig("particle.svg")

using QuantumOptics
b = FockBasis(50)
a = destroy(b)
at = create(b)
H = 0.5*(a^2 + at^2)
psi0 = fockstate(b, 3)
tout, psit = timeevolution.schroedinger([0:0.25:1;], psi0, H)

using PyPlot
x = [-5:0.1:5;]
for i in 1:4
    subplot(2, 2, i)
    Q = qfunc(psit[i], x, x)
    pcolor(x, x, Q)
end
tight_layout()
savefig("fock.png")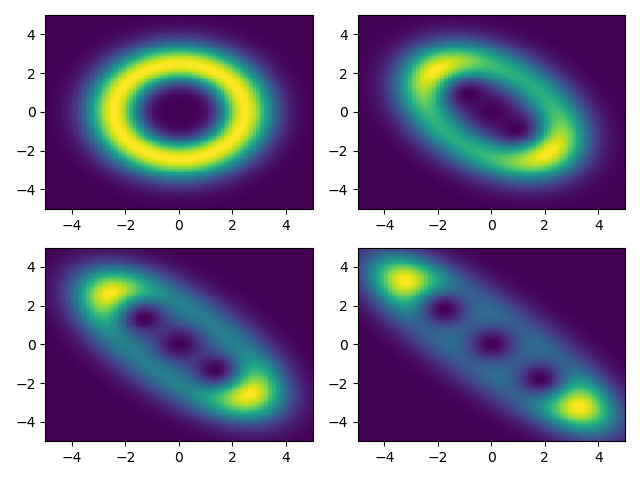
using QuantumOptics
b = SpinBasis(3//2)
sm = sigmam(b)
H = 2*sigmaz(b)
J = [sm]
τ = [0:0.025:5;]
ω = [-5:0.05:25;]
ρ0 = dm(spinup(b))
corr = timecorrelations.correlation(τ, ρ0, H, J, sigmap(b), sm)
ω, S = timecorrelations.spectrum(ω, H, J, sm)

using PyPlot
subplot(2, 1, 1)
plot(τ, corr)
xlabel(L"\tau")
ylabel(L"\langle \sigma_+(\tau) \sigma_-(0)\rangle")
subplot(2, 1, 2)
plot(ω, S)
xlabel(L"\omega")
ylabel(L"S(\omega)")
tight_layout()
savefig("spin.svg")
using QuantumOptics
b = NLevelBasis(3)
t12 = transition(b, 1, 2)
t23 = transition(b, 2, 3)
t31 = transition(b, 1, 3)
H = 10*(t31 + dagger(t31))
J = [1.2*t23, 0.6*t12]
psi0 = basisstate(b, 1)
T = [0:0.01:10;]
tout, psit = timeevolution.mcwf(T, psi0, H, J; seed=2)

using PyPlot
plot(tout, expect(dm(basisstate(b, 3)), psit), label=L"$|3\rangle$")
plot(tout, expect(dm(basisstate(b, 2)), psit), label=L"$|2\rangle$")
plot(tout, expect(dm(basisstate(b, 1)), psit), label=L"$|1\rangle$")
xlabel("Time")
ylabel("Probability")
legend()
tight_layout()
savefig("nlevel.svg")
using QuantumOptics
b_spin = SpinBasis(1//2)
b_fock = FockBasis(200)
sp = sigmap(b_spin)
sm = sigmam(b_spin)
a = destroy(b_fock)
at = create(b_fock)
H = sp⊗a + sm⊗at
T = [0:0.01:50;]
ψ0 = spindown(b_spin) ⊗ coherentstate(b_fock, 6)
tout, ψt = timeevolution.schroedinger(T, ψ0, H)

using PyPlot
plot(tout, expect(1, sp*sm, ψt))
xlabel("Time")
ylabel("Spin excitation")
tight_layout()
savefig("composite.svg")
using QuantumOptics
b_x = PositionBasis(-10, 10, 300)
b_p = MomentumBasis(b_x)
Tpx = transform(b_p, b_x)
Txp = transform(b_x, b_p)
x = position(b_x)
p = momentum(b_p)

Hkin = LazyProduct(Txp, p^2/2, Tpx)
Hpsi = diagonaloperator(b_x, Ket(b_x).data)
H = LazySum(Hkin, Hpsi)

fquantum(t, ψ) = (Hpsi.data.nzval .= -50 .* abs2.(ψ.data); H)
ψ₀ = gaussianstate(b_x,-2π,2,1.5) + gaussianstate(b_x,2π,-2,1.5)
normalize!(ψ₀)
tout, ψₜ = timeevolution.schroedinger_dynamic([0:0.01:6;], ψ₀, fquantum)
density = [abs2(ψ.data[j]) for ψ=ψₜ, j=1:length(b_x)]

using PyPlot
contourf(samplepoints(b_x),tout,density,50)
xlabel("x")
ylabel("Time")
savefig("gross_pitaevskii.png")

using QuantumOptics
bc = FockBasis(16)
ba = SpinBasis(1//2)
a = destroy(bc) ⊗ one(ba)
sm = one(bc) ⊗ sigmam(ba)
H0 = 0.5*sm'*sm + a + a'
Hx = 0.5*(a'*sm + a*sm')
J = [a, sqrt(2)*sm]
Jdagger = dagger.(J)

fquantum(t, ψ, u) = H0 + Hx*cos(u[1]), J, Jdagger
function fclassical(t, ψ, u, du)
  du[1] = 0.3*real(u[2])
  du[2] = sin(real(u[1]))*real(expect(dagger(a)*sm, ψ))
end
u0 = ComplexF64[sqrt(2), 6.0]
ψ0 = semiclassical.State(fockstate(bc, 0)⊗spindown(ba), u0)
tout, p = semiclassical.master_dynamic([0:1.0:200;], ψ0, fquantum,
      fclassical; fout=(t,rho)->rho.classical[2])

using PyPlot
plot(tout, p.^2)
ylabel("Kinetic energy")
xlabel("Time")
savefig("cooling.svg")

Besides the above quick start code snippets QuantumOptics.jl comes with an extensive documentation and many detailed examples.
QuantumOptics.jl is developed in Helmut Ritsch's CQED group at the Institute for Theoretical Physics of the University of Innsbruck. The framework was conceived by Sebastian Krämer in 2017/2018. Between 2018 and 2021 it has been maintained and extended by David Plankensteiner, who took it to version 1.0 in July 2021. At the moment Christoph Hotter and Laurin Ostermann are responsible for its well-being. QuantumOptics.jl is open source and hosted on GitHub. All community contributions are very welcome. If you want to join our effort, fork the repository and send us your pull requests!